Correlate traces and logs 
This guide explains how to correlate traces with logs in Grafana Tempo. When set up correctly, clicking a trace shows the associated logs — and clicking a log line links back to its trace.
Prerequisites 
- Auto-instrumentation enabled (or manual OTel SDK setup)
How it works 
The OTel Java agent automatically injects trace_id and span_id into your logging framework's MDC (Mapped Diagnostic Context). If your log output includes MDC fields, correlation works out of the box — no extra dependencies needed.
Most Nav apps already have this working. If you use LogstashEncoder (which outputs all MDC fields as JSON), trace context is already in your logs.
Verify it works 
- Open Nais APM and find a trace for your service
- Click "View logs" — if correlated logs appear, you're done
If logs don't appear, check the troubleshooting section below.
Log format requirements 
If you use LogstashEncoder, all MDC fields (including trace_id and span_id) are included automatically:
<appender name="STDOUT" class="ch.qos.logback.core.ConsoleAppender">
    <encoder class="net.logstash.logback.encoder.LogstashEncoder" />
</appender>
No extra dependencies or appender wrapping needed when using auto-instrumentation.
If you use a plain PatternLayout, add %X{trace_id} and %X{span_id} to your pattern:
<pattern>%d{HH:mm:ss.SSS} [%t] %-5level %logger{36} traceId=%X{trace_id} spanId=%X{span_id} - %msg%n</pattern>Log4j2 context data injection is automatic with the OTel agent. Use %X{trace_id} in your pattern:
<PatternLayout pattern="%d{HH:mm:ss.SSS} [%t] %-5level %logger{36} traceId: %X{trace_id} spanId: %X{span_id} - %msg%n" />Correlation is automatic with Node.js auto-instrumentation. The trace and span IDs are included in logs without extra config.
If you use Next.js, add the packages to serverExternalPackages to prevent tree-shaking:
// next.config.js
module.exports = {
  serverExternalPackages: ['@navikt/pino-logger', 'pino'],
};
Correlation is automatic with Node.js auto-instrumentation.
Add to serverExternalPackages:
// next.config.js
module.exports = {
  serverExternalPackages: ['@navikt/next-logger', 'pino'],
};
Without auto-instrumentation 
If your app does not use Nais auto-instrumentation, you need to inject trace context into MDC manually. Add the OpenTelemetry logback appender:
io.opentelemetry.instrumentation:opentelemetry-logback-mdc-1.0:2.16.0-alpha<appender name="OTEL" class="io.opentelemetry.instrumentation.logback.mdc.v1_0.OpenTelemetryAppender">
<appender-ref ref="STDOUT" />
</appender>
<root level="INFO">
<appender-ref ref="OTEL" />
</root>Troubleshooting 
If trace-log correlation isn't working:
- Check your logs contain
trace_id— query Loki for your app and look for the field - Verify auto-instrumentation is enabled — check your nais.yaml has
autoInstrumentation.enabled: true - Check LogstashEncoder — if you use a custom pattern, make sure
%X{trace_id}is included
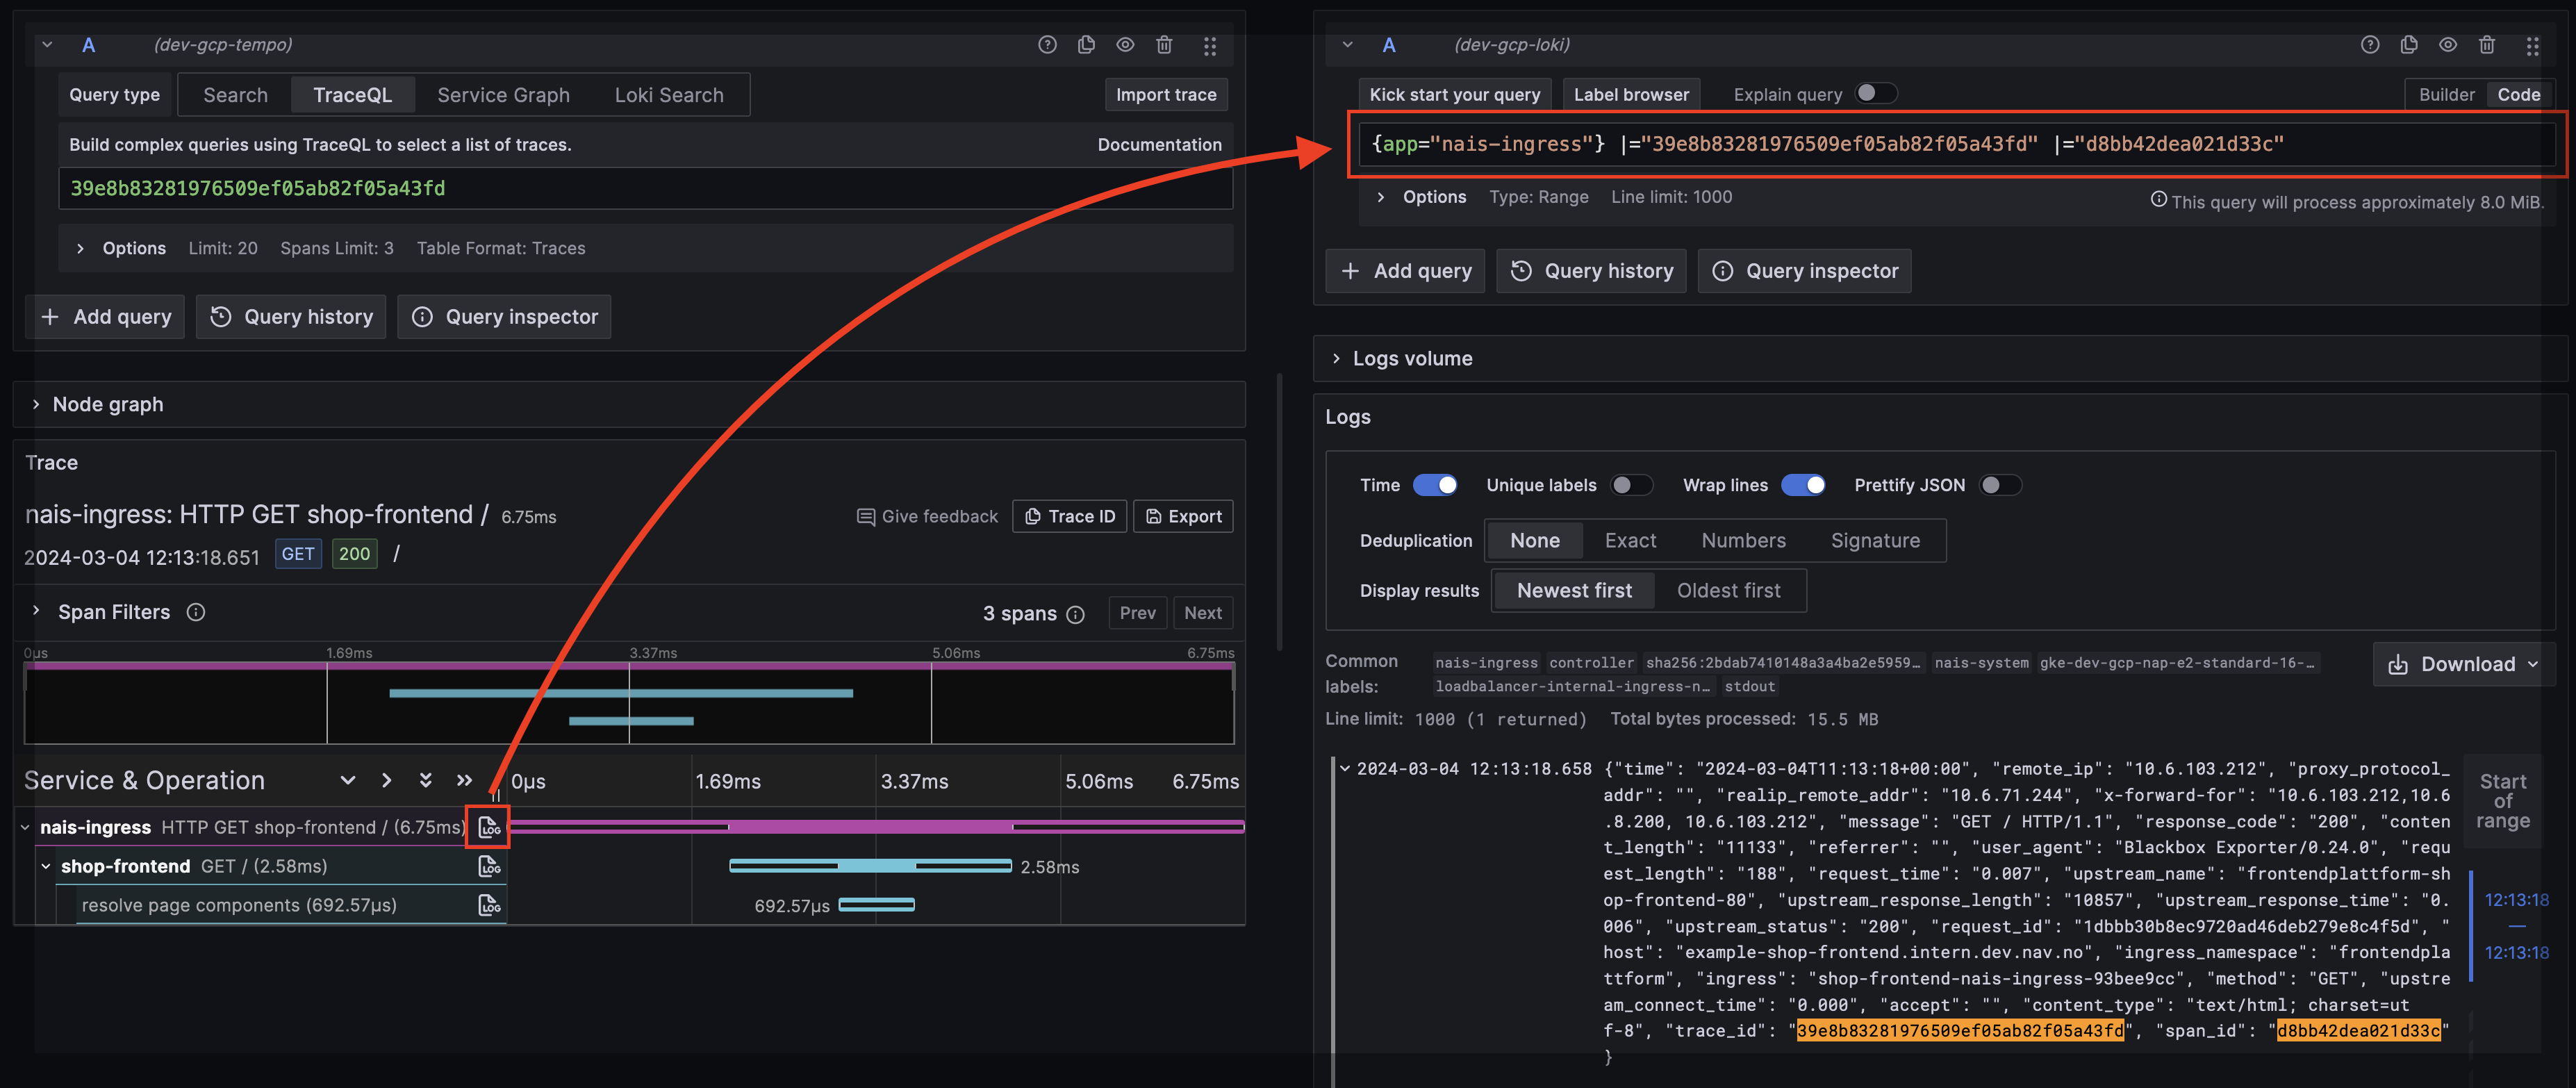
Result 
When correlation works, Grafana Tempo shows associated logs inline with your trace: